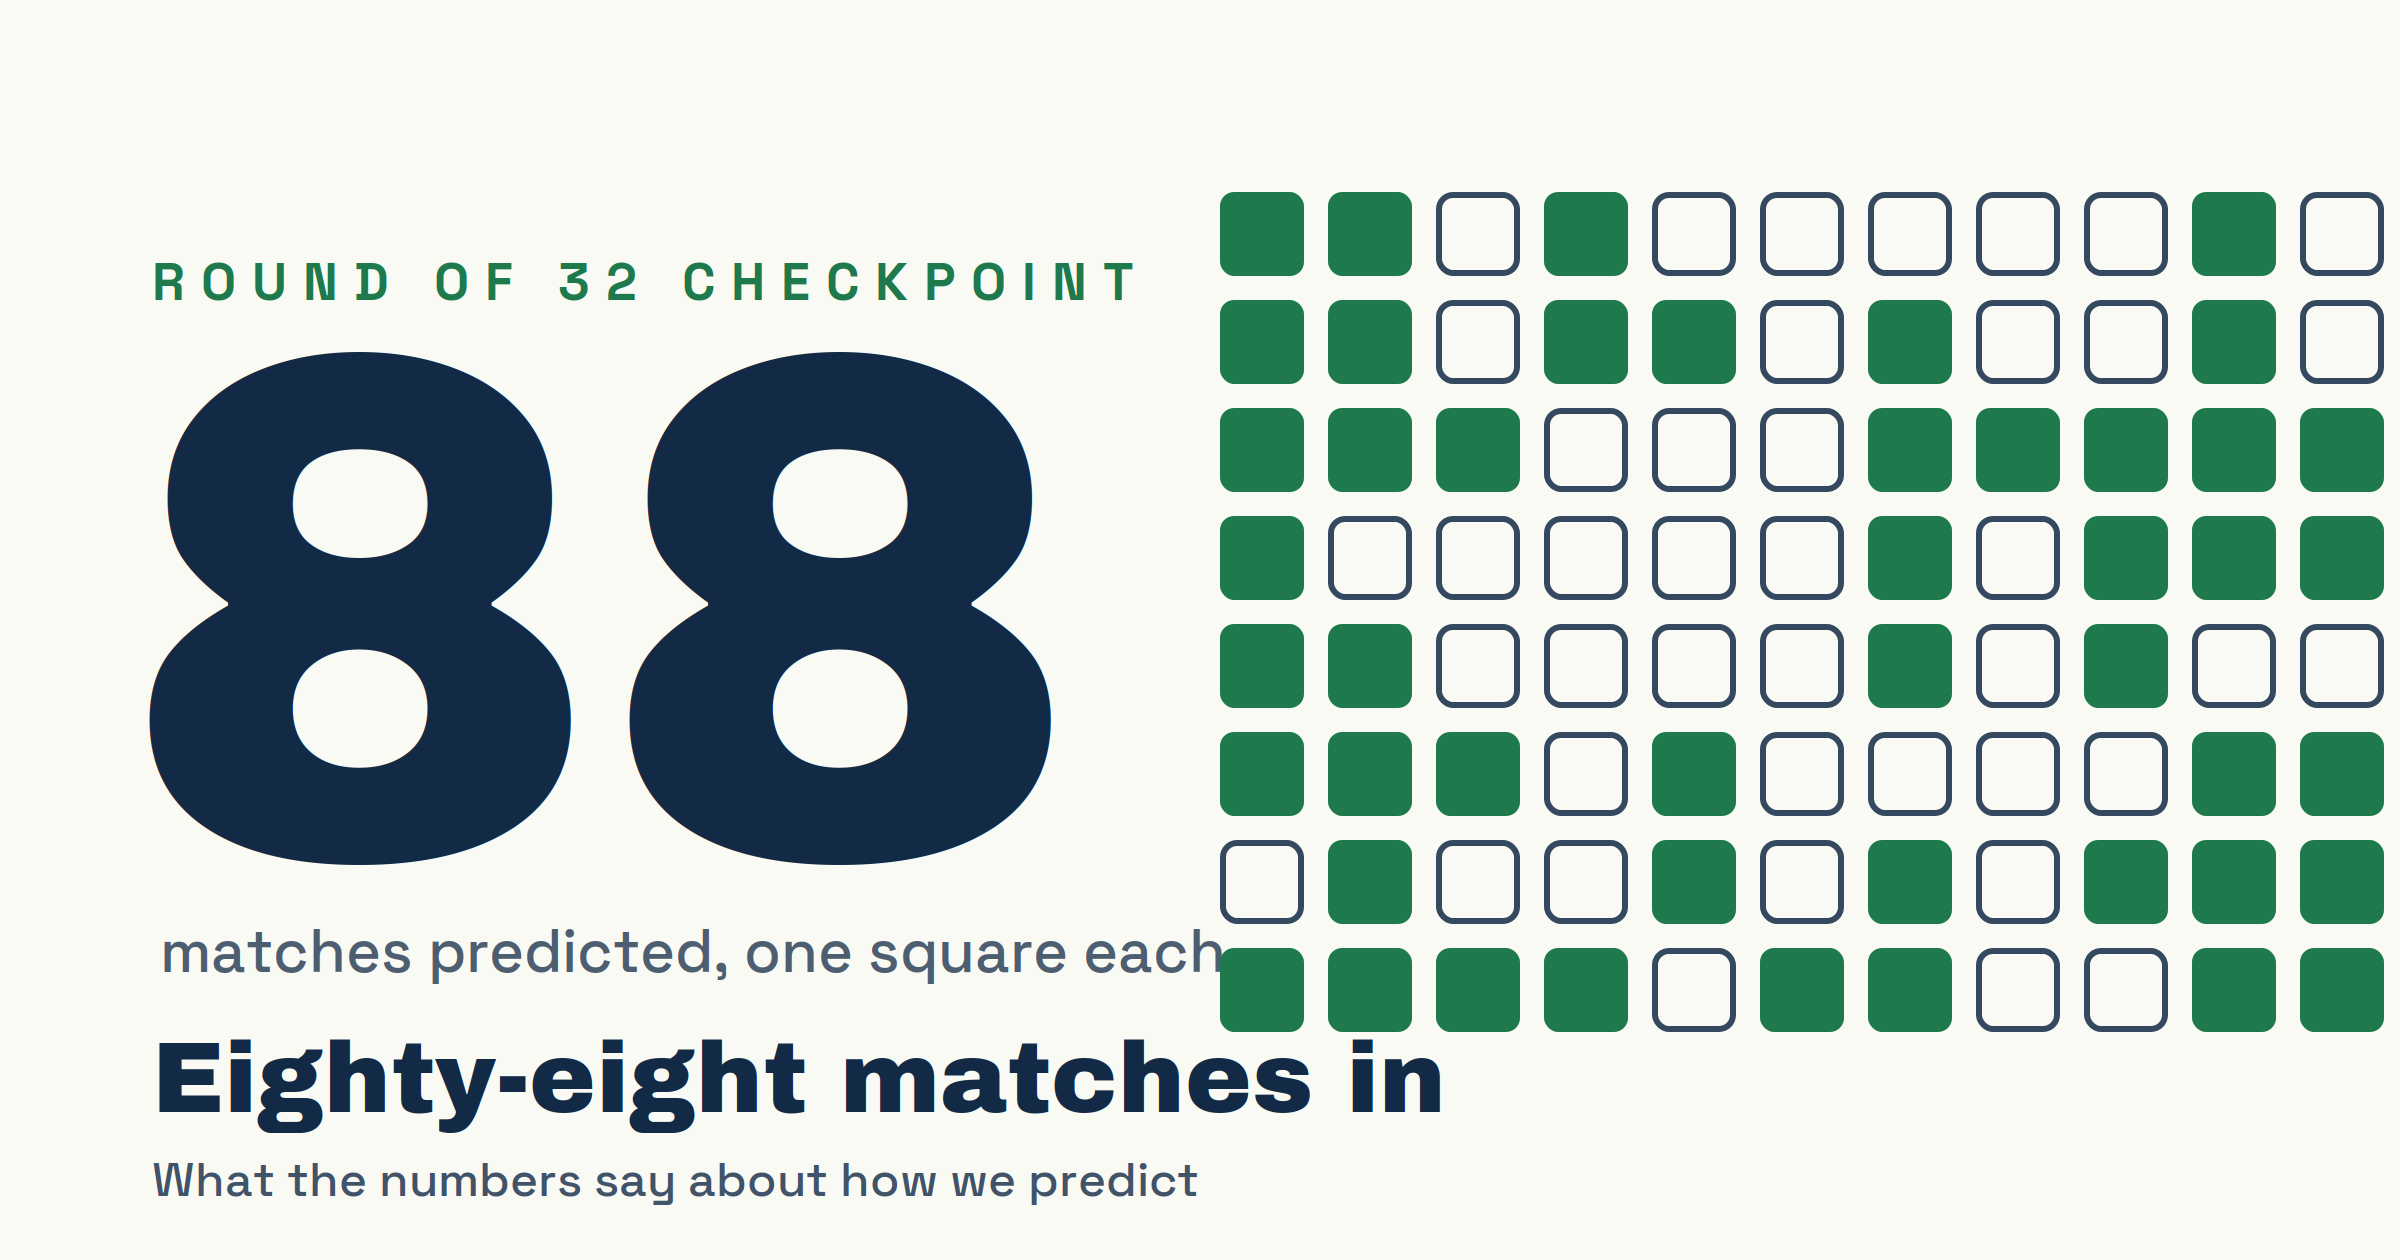
Eighty-eight matches are in the books and 97 of you have been filling coupons since the opening whistle. That is enough data to stop arguing about what works in this pool and start measuring it. So we did. What follows is the full autopsy: how we predict, where the points really come from, and why the safest coupon in the pool is also a guarantee of mediocrity.
FIFA World Cup 2026
We love a favourite. The tournament only partly agrees.
As a pool we backed the favourite in 76% of matches, and favourites delivered in roughly two out of three. That gap is the price of comfort, and it compounds quietly across 88 games. Draws tell the opposite story: we predicted them in 18% of matches, but the tournament served them up in 26%. On underdogs our volume was about right, 6% predicted against 7% actual, but our aim was not: only 9% of underdog picks landed. The lesson sits in the accuracy bars below. Favourite picks hit at 70%, draw picks at 33%, so a well chosen draw was worth far more to your total than yet another routine favourite. Liam Grech leads the pool on accuracy at 69%, Dave Evans props it up at 35%, and the average sits at 59%.
Result split — predicted vs actual
Accuracy by pick type
Best: Liam Grech (69%)
Worst: Dave Evans (35%)
Pool average: 59%
Where the points actually come from
If you think this game is about calling winners, the scoreboard disagrees. Over/under is the single biggest source of points in the pool, 41% of everything scored, comfortably clear of correct results at 32%. The exact scores we agonise over the longest contribute a humbling 5%. In other words, the quiet tick-box at the bottom of the coupon has been worth eight times the glamour pick.
Where the points came from
The coin flip that is not one
Totals look like a coin flip, but the coin is loaded. With 2.92 goals per game, 55% of matches have gone over, so a player blindly ticking over on every coupon would have banked 240 points against the pool average of 221. Under is where the pain lives. When players went under, they lost by two or more goals 36% of the time, which means those were not near misses but misreads of the whole match. Pick under when you have a reason, not a feeling.
Over/under — is it a coin flip?
What actually happened
Dashed line = 50% — a coin flip.
What happens when players pick under
stayed under — won lost by 1 goal lost by 2+
The favourite trap
Now for the humbling part. A bot that picked Favourite 1-0 in every single match, without watching a minute of football, would currently sit 52nd of 97. It beats nearly half the pool. The same bot on 2-1 lands 59th. So if your strategy has been safety, a spreadsheet formula is breathing down your neck. The data behind it is unambiguous: the more favourites a player backed, the fewer points they scored, a strong correlation across the whole pool. And the players who escaped that gravity did it the only way possible. Nine of the top ten climbed on three or more big-odds hits. Safety is not a strategy in this pool. It is a ceiling.
Same result, every game
Pick Favourite 1–0 every game and you would finish #52 of 97 (551.78 pts).
Draws hit 26% of games but were priced at 22%.
9 of the top 10 climbed on 3+ big-odds hits — pool average: 4.2.
The favourite trap: the more favourites you backed, the fewer points you scored (r 0.81).
Matches we nailed, matches that nailed us
Brazil 3-0 Haiti was the pool’s finest hour, called exactly by 48 players. Uzbekistan v Colombia was our most united coupon, with more than half of us on the same 0-2. At the other end of the dignity scale sits Spain v Cape Verde: every single player backed the favourite, and the game finished 0-0, the single biggest collective miss of the tournament. Germany 7-1 Curaçao supplied the fireworks, Japan v Sweden scattered us across fifteen different scorelines, and Belgium v Senegal split the room almost down the middle.
The scorelines that never showed up
A moment of silence for the ghosts. Thirty-five picks went on 2-3, fourteen on 0-5, and seven optimists backed a 7-0, none of which has happened anywhere in 88 matches. Meanwhile the pool’s overall instincts were sound in one respect: 2-1 was our most-picked scoreline, and 1-1 the most common actual result, appearing twelve times. The problem is not our sense of what football looks like. It is that we keep parking it on the wrong team.
Most-picked scorelines that never happened
1% of all predictions were on results that never occurred.
What the top ten do differently
The leaders confirm the pattern. The top ten’s biggest edge over the rest of us is not clairvoyance on results, where they hold a modest advantage, but discipline on totals: 51 over/under hits against the pool’s 44, worth 35 extra points on that category alone. Nathan Heep leads on 650.22, with Daphne Hili, who also tops the exact-score count with 16, less than seventeen points behind. Ten men could not stop her; a two-goal swing certainly could not.
Where points are won — top 10 vs pool average
Over / under
Correct results
Standings
- 1Nathan Heep650.22
- 2Daphne Hili633.44
- 3Karl Vassallo630.84
- 4Daniel Sammut625.92
- 5Gary Rizzo625.66
Completed matches only (confirmed final scores).
Eighty-eight down, sixteen to go. The knockout rounds will punish the timid and reward anyone brave enough to price a draw before extra time or an ugly under correctly. When the trophy is lifted we will run these numbers one last time and find out who was actually paying attention. Until then: fewer reflex favourites, more conviction on totals, and no more picks on 2-3.