Category: Fussspool

  • Spain go the distance. So does Kevin Farrugia

    Spain go the distance. So does Kevin Farrugia

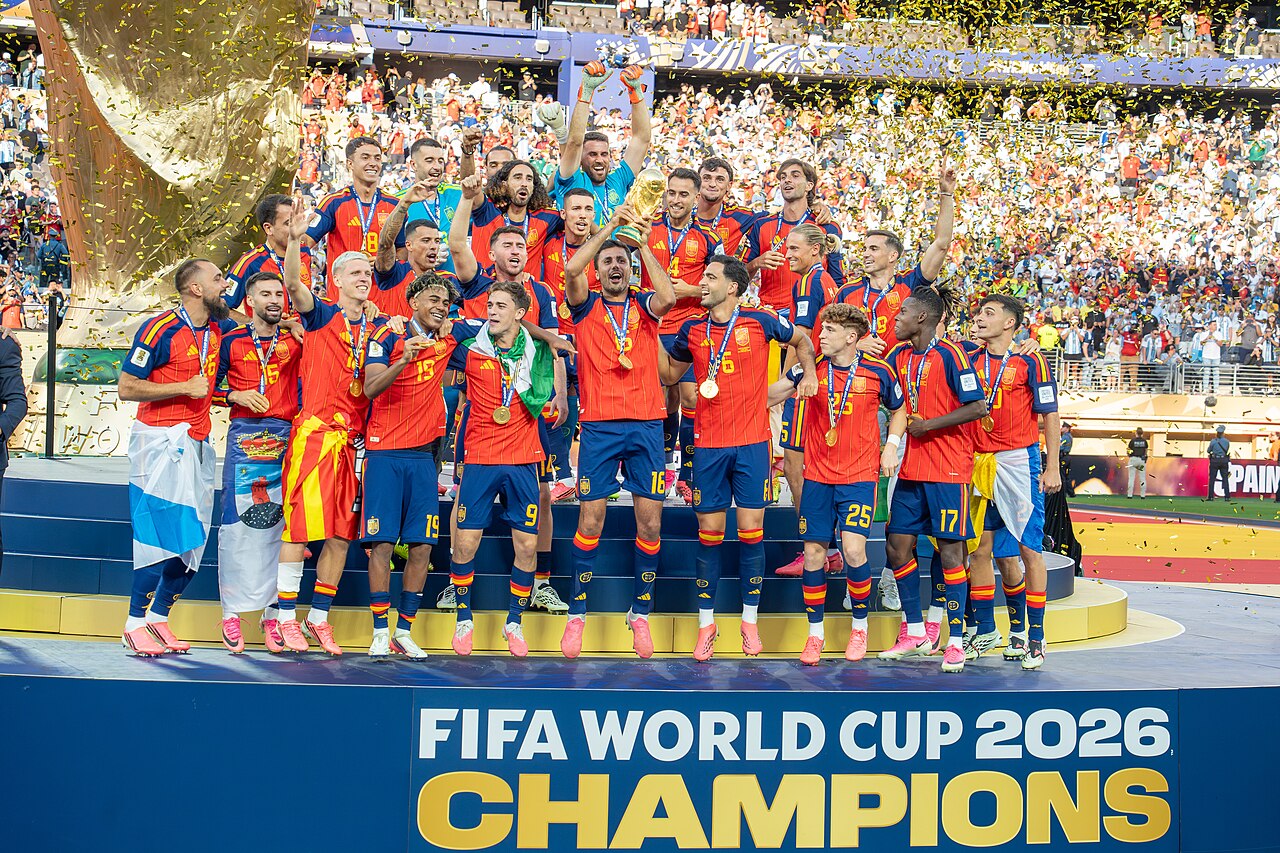
    Spain are world champions, and it took them until extra time to do it. One hundred and four matches, thirty-nine days, and the whole thing came down to a final that refused to end when it was supposed to.

    And after ninety-seven of us spent five weeks playing with the app, Fussspool 2026 has a champion too.

    Kevin Farrugia wins it

    843.88 points. Eight and a bit clear of Liam Grech. Congratulations, Kevin — and a genuinely well-earned one, because holding a lead in this pool has been about as easy as holding a lead against Spain.

    Final standings

    1. 1Kevin Farrugia843.88
    2. 2Liam Grech835.18
    3. 3Michael Probert825.28
    4. 4Russell Camilleri822.94
    5. 5Daniel Sammut820.22

    Completed matches only (confirmed final scores).

    Look at that top five against where we stood at the quarterfinal break, though, because it tells you how violent the closing stages were. Michael Probert and Russell Camilleri finished third and fourth — neither of them was in the top five four matches ago. Nathan Heep and Andrew Arrigo were third and fifth and both dropped out. Only Kevin and Daniel Sammut were still standing where they’d been.

    Here is the cruellest number of the lot. Over the semifinals, the third-place playoff and the final, Kevin scored 44.66 points. Liam Grech scored 49.22 — more than the champion, more than anyone near the top — and it still wasn’t enough. He arrived four matches too late.

    How the title was actually won: by not letting go

    Five different players led this pool across the first six rounds. Mark Camilleri, Niki Borg, Nathan Heep, Daniel Sammut, then Kevin. Nobody had managed to hold the top spot through more than two rounds all tournament.

    Kevin took it after the quarterfinals and then held it after the semifinals, after the third-place playoff, and after the final. Four consecutive rounds at number one, in a tournament that had changed leader at almost every opportunity. That is the entire story of this championship: the man who took the lead last, and then simply refused to be overtaken.

    The Race — leader after every round

    1. Matchday 1Mark Camilleri
    2. Matchday 2Niki Borg
    3. Matchday 3Nathan Heep
    4. Round of 32Nathan Heep
    5. Round of 16Daniel Sammut
    6. QuarterfinalsKevin Farrugia
    7. SemifinalsKevin Farrugia
    8. Match for third placeKevin Farrugia
    9. FinalKevin Farrugia

    Gold marks a new leader; plain text means the same player held top spot.

    Liam Grech95th → 2ndclimbed
    Robert Attard91st → 13thclimbed

    Liam Grech’s tournament deserves its own paragraph. Ninety-fifth of ninety-seven after the group stage. Second at the end. He was fourth at the quarterfinal break and kept climbing right through to the last whistle. If this pool gave out a comeback award, there would be no debate and no vote.

    The knockouts ate the favourites alive

    Something happened in those last four matches that reshaped the entire tournament’s numbers, and it explains every one of those wild swings in the standings.

    Across the first 100 matches, underdogs won 8% of the time. Across all 104, they won 11%. That jump — three percentage points, on a base of 104 — means the great majority of the closing matches went to the team nobody was supposed to back. Not one of them was drawn inside ninety minutes. The pool’s collective pick was wrong in three of the final four.

    Result split — predicted vs actual

    Win — favourite
    Predicted74%
    Actual66%
    Draw
    Predicted18%
    Actual23%
    Win — underdog
    Predicted7%
    Actual11%

    The knock-on effect shows up in the accuracy numbers. Underdog picks were landing at a miserable 13% at the quarterfinal break. By the end they were at 19%. Every brave coupon submitted in the closing rounds got paid, and the people who submitted them are the reason the top five looks nothing like it did a week ago.

    Accuracy by pick type

    Favourite picks69%
    Draw picks29%
    Underdog picks19%

    Best: Liam Grech (71%)

    Worst: Dave Evans (35%)

    Pool average: 58%

    Liam Grech finishes as the most accurate reader of this tournament — 71% of results called correctly against a pool average of 58%. Dave Evans finishes on 35%, and having held that position from the quarterfinals to the final, he has at least been magnificently consistent about it.

    We finally beat the robot

    At the quarterfinal break we ran a slightly humiliating experiment: a hypothetical player who submits “favourite wins 2–1” on every single match, with no thought whatsoever, would have been sitting 15th of 97. Eighty-two of us were losing to a robot with one idea.

    Four matches later, that robot has slipped to 19th. The Hive Mind — the theoretical player who always submits the pool’s most popular pick — has fallen from 22nd to 26th. When the underdogs started winning, the mindless strategies had no answer, and actual human judgement finally pulled ahead.

    Same result, every game

    Pick Favourite 2–1 every game and you would finish #19 of 97 (783.64 pts).

    1–1 every game477.78#91
    2–2 every game510.78#91
    Favourite 1–0 every game726.64#49
    Underdog 1–0 every game401.50#93
    Favourite 2–1 every game783.64#19
    The Hive Mind (pool’s pick each game)766.20#26
    Most-picked 2-1 every game672.84#78

    Draws hit 23% of games but were priced at 23%.

    10 of the top 10 climbed on 3+ big-odds hits — pool average: 5.2.

    The favourite trap: the more favourites you backed, the fewer points you scored.

    The best evidence sits in the strategy table itself. “Underdog 1–0 every game” — the worst idea in the entire experiment, dead last for the whole tournament — picked up more points across the final four matches than any other fixed strategy on the board. It gained over sixty. The favourite-based strategies gained roughly half that.

    Which is a very long way of saying: the closing stages belonged to whoever was brave.

    Two matches nobody in this pool will forget

    The last four matches gave us the highest-scoring game of the entire World Cup. France 4–6 England. Ten goals. It knocked Germany’s 7–1 demolition of Curaçao off a perch it had held since the group stage, and it did it in a knockout match, which is not how knockout matches are supposed to work.

    Those closing rounds also produced the single most divided match in Fussspool history: England v Argentina, with 32 of us backing the home side and 31 backing the away side. A ninety-seven-strong pool, split almost exactly in half. Whatever you thought was going to happen in that game, roughly half the room thought the opposite.

    France 4-6 EnglandHighest-scoring match10 goals
    England v ArgentinaMost contested gamehome 32 · away 31
    Spain v Cape VerdeBiggest collective miss100% backed the favourite · finished 0-0
    Brazil 3-0 HaitiMost-nailed match48 of 94 nailed it
    Japan v SwedenMost varied scorelines15 scorelines · top 37%
    Uzbekistan v ColombiaMost united match53% on 0-2

    Those ten goals dragged the tournament scoring average up from 2.92 to 2.96 goals a game in the space of four matches. The closing stages ran at roughly four goals a game — comfortably the most open football of the whole World Cup, at precisely the point when everyone expected it to tighten up.

    Where the title was won: the boring column

    We said this at the quarterfinals and the final four matches only made it more true. Over/under is the biggest single source of points in this competition — 25,060 of them, 37% of everything scored all tournament. The exact scoreline everybody agonises over accounts for 4%.

    Where the points came from

    19,452Result29%
    25,060Over / under37%
    2,934Exact4%
    19,840Winner29%

    And here, finally, is the cleanest explanation of why the top ten are the top ten. It isn’t flair. It’s seven more over/under hits and ten more correct results than the average player, accumulated one coupon at a time over 104 matches. That’s a 73-point advantage built almost entirely out of the least glamorous part of the form.

    Where points are won — top 10 vs pool average

    Over / under
    Top 1059 hits294 pts
    Pool avg52 hits258 pts
    Correct results
    Top 1067 hits238 pts
    Pool avg57 hits201 pts

    It stayed an over tournament to the last kick. A player who simply ticked OVER every single time, without a moment’s thought, would have finished on 290 over/under points against a pool average of 258. Thirty-two free points for doing less thinking. Store that one away for 2028.

    Over/under — is it a coin flip?

    What actually happened

    56% over44% under
    Always pick OVER56%290 pts
    Pool average53%258 pts
    Always pick UNDER44%230 pts

    Dashed line = 50% — a coin flip.

    What happens when players pick under

    46%17%36%

    stayed under — won lost by 1 goal lost by 2+

    The tournament in full

    One hundred and four matches. Ninety-seven of us. Here is what we collectively got right and wrong.

    FIFA World Cup 2026

    104 completed matches · 97 players

    75%Favourite backed
    68%Favourite won6% gap to backing
    2.96Goals / game
    58%Result hit rate
    10%Correct score hit rate

    We backed the favourite three times in every four. The favourite delivered roughly two times in three. That gap is the tax this pool paid all summer, and it never once closed.

    33Near-unanimous gamesfav 27 · draw 6 · u/dog 0
    33%Pool favourite missed34 of 104 matches
    23%Draw-capture rateacross 24 drawn games
    17Exact-score leadersDaphne Hili1 still on zero
    2-1Most-picked scoreline16% of all predictions · 9% of matches
    1-1Most common resulthappened 12 times

    Daphne Hili ends the tournament as the exact-score champion on 17 — and she added one more in the closing stages, when the scorelines were at their least predictable. Somewhere in this pool there is still one player who never called a single scoreline correctly across 104 matches. We’re still not naming them. They still know.

    Thirty-three matches were near-unanimous. In twenty-seven of them we all backed the favourite, in six we all called a draw, and in exactly zero did this pool collectively fancy an underdog. Given how the last week went, that might be the most instructive number of the entire competition.

    Monster favourites

    23 matches where the shortest price was 1.30 or less

    18Won
    5Drew
    0Lost

    The giants never lose… they draw.

    The best single call of the World Cup

    It survived the whole tournament. Ninety-five of us looked at Ecuador v Curaçao and did the sensible thing. Two didn’t, took 0–0 at a price of 9.99, and banked 27.98 points from one match. Nothing in the semifinals, the third-place playoff or the final came close to beating it.

    Biggest single-match jackpot

    27.98Alan Arrigo & Sylvana Bosch — the only 2 of 97 who dared Ecuador v Curaçao (0-0) at odds 9.99

    And we remained gloriously optimistic to the end. Fourteen of us predicted a 0–5 at some point. Seven went 7–0. Across 104 matches, none of it happened.

    Most-picked scorelines that never happened

    0-514 picks
    7-07 picks
    2-45 picks
    5-23 picks
    4-32 picks

    See you at Euro 2028

    That’s it. Spain are champions, Kevin Farrugia is our champion, and ninety-seven coupons go quiet for a while.

    Thank you to every single one of you who submitted a prediction, argued about a scoreline, backed a 9.99 shot on a Tuesday night, or refused to change a pick out of pure stubbornness and was proved right. A pool of ninety-seven is what makes any of these numbers interesting — with ten players, none of this exists.

    Take what you learned. Back a few more draws. Tick OVER more often than feels comfortable. And remember that the player who wins is rarely the one who calls the miracle — it’s the one who stops giving points away.

    Euro 2028. Coupons open closer to the time. See you there.
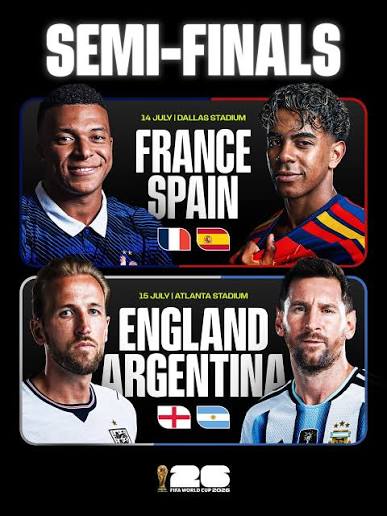
  • One hundred matches down. Four to go

    One hundred matches down. Four to go

    Ninety-seven of us started this thing with a coupon and a theory, and after five weeks the pool has produced exactly what a World Cup should: a leaderboard nobody predicted, a leader who has held the top spot for about a week, and a pile of evidence that most of us were wrong about how to win.

    Here is where things stand, and what the numbers say about how we got here.

    FIFA World Cup 2026

    100 completed matches · 97 players

    75%Favourite backed
    70%Favourite won5% gap to backing
    2.92Goals / game
    59%Result hit rate
    10%Correct score hit rate

    The top five, and the fourteen points between them

    Kevin Farrugia leads on 799.22. Daniel Sammut is 6.66 behind. Nathan Heep is 0.08 behind him. Liam Grech and Andrew Arrigo sit within fifteen points of the summit.

    That is not a lead. That is a rounding error with a trophy attached. One correct scoreline at a decent price in the semifinals settles this — and there are still four matches to play.

    Standings

    1. 1Kevin Farrugia799.22
    2. 2Daniel Sammut792.56
    3. 3Nathan Heep792.48
    4. 4Liam Grech785.96
    5. 5Andrew Arrigo784.44

    Completed matches only (confirmed final scores).

    Five leaders in six rounds

    Nobody has owned this tournament. Mark Camilleri led after Matchday 1. Niki Borg took it on Matchday 2. Nathan Heep grabbed it on Matchday 3 and was the only player to hold the top spot through a full round. Daniel Sammut led out of the Round of 16. Kevin Farrugia leads now.

    Underneath, the knockouts have been carnage. Liam Grech was 95th of 97 after the groups and is now fourth. Gary Rizzo went 87th to 8th. And spare a thought for graziella chircop, who was second and is now 79th — the harshest fall of the tournament, and a reminder that a good group stage buys you nothing.

    The Race — leader after every round

    1. Matchday 1Mark Camilleri
    2. Matchday 2Niki Borg
    3. Matchday 3Nathan Heep
    4. Round of 32Nathan Heep
    5. Round of 16Daniel Sammut
    6. QuarterfinalsKevin Farrugia

    Gold marks a new leader; plain text means the same player held top spot.

    Liam Grech95th → 4thclimbed
    Gary Rizzo87th → 8thclimbed
    graziella chircop2nd → 79thharshest fall

    The bit nobody wants to read

    Imagine a player who never watched a match, never read a preview, never agonised over whether to go 2–1 or 2–0. Every single game, they wrote down the same thing: favourite wins 2–1. Done. Coupon in, phone away.

    That player would be 15th of 97 right now, on 758.98 points.

    Eighty-two of us — five weeks of research, group chats, gut feelings, late-night edits before kickoff — are behind a robot with one idea. The robot also beats the Hive Mind, the theoretical player who submits whatever the pool’s most popular pick is each game (741.54, 22nd).

    Same result, every game

    Pick Favourite 2–1 every game and you would finish #15 of 97 (758.98 pts).

    1–1 every game467.78#92
    2–2 every game500.78#91
    Favourite 1–0 every game698.98#46
    Underdog 1–0 every game340.98#93
    Favourite 2–1 every game758.98#15
    The Hive Mind (pool’s pick each game)741.54#22
    Most-picked 2-1 every game648.18#78

    Draws hit 24% of games but were priced at 23%.

    10 of the top 10 climbed on 3+ big-odds hits — pool average: 4.7.

    The favourite trap: the more favourites you backed, the fewer points you scored (r 0.82).

    Note the last footnote, because it is the whole tournament in one line. The more favourites you backed, the fewer points you finished with. Every player at the top of this table climbed there on the back of at least three big-odds hits.

    We love a favourite. We hate a draw.

    Across 100 matches, the pool backed the favourite 75% of the time. The favourite actually won 68% of the time. That five-to-seven point gap is not a rounding error — over 100 matches it is a systematic tax on everyone’s coupon.

    The gap has to go somewhere, and it went where it always goes: the draw. We predicted draws in 18% of games. Twenty-four percent of games were drawn.

    Result split — predicted vs actual

    Win — favourite
    Predicted75%
    Actual68%
    Draw
    Predicted18%
    Actual24%
    Win — underdog
    Predicted7%
    Actual8%

    And when we did call a draw, we were mostly wrong anyway: draw picks landed just 31% of the time, against 71% for favourite picks. Underdog picks came in at a bruising 13%.

    Accuracy by pick type

    Favourite picks71%
    Draw picks31%
    Underdog picks13%

    Best: Liam Grech (72%)

    Worst: Dave Evans (35%)

    Pool average: 59%

    Liam Grech has read this tournament better than anyone — 72% of his results correct, against a pool average of 59%. Which is precisely how you go from 95th to 4th. At the other end, Dave Evans is on 35%, and we salute the commitment.

    Over/under: the quiet kingmaker

    Ask anyone in the pool where the points are and they will talk about scorelines. They are wrong.

    Over/under is the single largest source of points in this tournament — 24,205 of them, 37% of everything scored. The exact-score jackpot everyone chases? Four percent. We are all straining for the hardest points on the board while the biggest pot sits in the box most people tick in two seconds.

    Where the points came from

    18,931Result29%
    24,205Over / under37%
    2,844Exact4%
    18,640Winner29%

    Here is the part that stings. The tournament has been an over tournament — 56% of matches went over the line, at 2.92 goals a game. A player who simply ticked OVER every single time, without thought, would have banked 280 points. The pool average is 250.

    Thirty points, free, for doing less thinking. And when we backed under, we lost by two goals or more in 37% of cases — that is not bad luck, that is a read on the tournament that was simply wrong.

    Over/under — is it a coin flip?

    What actually happened

    56% over44% under
    Always pick OVER56%280 pts
    Pool average52%250 pts
    Always pick UNDER44%220 pts

    Dashed line = 50% — a coin flip.

    What happens when players pick under

    46%17%37%

    stayed under — won lost by 1 goal lost by 2+

    Which brings us to the cleanest explanation of the leaderboard there is. Compare the top ten against everyone else. They are not wildly better at picking winners. They are better at the boring stuff, consistently, over 100 matches — six more over/under hits and eight more correct results than the average player. That is 67 points of daylight, accumulated a coupon at a time.

    Where points are won — top 10 vs pool average

    Over / under
    Top 1056 hits281 pts
    Pool avg50 hits250 pts
    Correct results
    Top 1065 hits231 pts
    Pool avg57 hits195 pts

    The giants never lose. They draw.

    Twenty-three times this tournament, a team went into a match at 1.30 or shorter. Not one of them lost. Eighteen won. Five drew.

    So the instinct to back the monster is sound. The trap is the scoreline: those five draws are where a lot of coupons quietly bled out, and they are the reason the favourite-heavy strategy underperforms despite favourites winning most of the time.

    Monster favourites

    23 matches where the shortest price was 1.30 or less

    18Won
    5Drew
    0Lost

    The giants never lose… they draw.

    The single best call of the tournament

    Ninety-five of us looked at Ecuador v Curaçao and did the sensible thing. Two of us didn’t.

    Sylvana Bosch and Alan Arrigo went 0–0 at a price of 9.99, and walked away with 27.98 points from one match — the biggest single-match haul anyone has managed. That is roughly twice the entire gap between first and fifth place, from one game, off one contrarian coupon.

    Biggest single-match jackpot

    27.98Sylvana Bosch & Alan Arrigo — the only 2 of 97 who dared Ecuador v Curaçao (0-0) at odds 9.99

    Moments the pool will not forget

    Spain v Cape Verde is the one that will live longest. Every single one of us — 100%, no dissenters, not one brave soul — backed the favourite. It finished 0–0. A perfectly unanimous pool, perfectly wrong, together.

    Brazil 3-0 HaitiMost-nailed match48 of 94 nailed it
    Japan v SwedenMost varied scorelines15 scorelines · top 37%
    Uzbekistan v ColombiaMost united match53% on 0-2
    Germany 7-1 CuraçaoHighest-scoring match8 goals
    Spain v Cape VerdeBiggest collective miss100% backed the favourite · finished 0-0
    Belgium v SenegalMost contested gamehome 37 · away 26

    We are also, collectively, wildly optimistic about goals. Fourteen of us predicted a 0–5. Seven went 7–0. None of it happened.

    Most-picked scorelines that never happened

    0-514 picks
    7-07 picks
    2-45 picks
    5-23 picks
    4-32 picks

    0% of all predictions were on results that never occurred.

    And a few numbers that say everything about how this pool thinks: our favourite scoreline is 2–1 (15% of every prediction submitted, but it only actually happened in 9% of matches). The most common real result was 1–1, twelve times. Thirty-three matches were near-unanimous, and in exactly zero of them did we collectively back an underdog.

    33Near-unanimous gamesfav 27 · draw 6 · u/dog 0
    31%Pool favourite missed31 of 100 matches
    23%Draw-capture rateacross 24 drawn games
    16Exact-score leadersDaphne Hili1 still on zero
    2-1Most-picked scoreline15% of all predictions · 9% of matches
    1-1Most common resulthappened 12 times

    Daphne Hili has sixteen exact scorelines. One player, somewhere in this pool, still has zero. We’re not naming them. They know.

    Four matches left

    Two semifinals, a third-place playoff, a final. That’s it. That’s all the football left.

    Fourteen points separate first from fifth, and one 9.99 shot has already been worth twenty-eight. Kevin Farrugia leads, but he has held the top spot for one round out of six, and every previous leader in this tournament has been overtaken. Daniel Sammut and Nathan Heep are close enough to pass him on a single scoreline. Liam Grech is the form player in the pool and is climbing.

    If the last 100 matches taught us anything, it’s this: the favourite usually wins, but backing the favourite doesn’t. The points are in the draws nobody calls, the overs nobody thinks about, and the one match where you look at a price of 9.99 and decide to be brave.

    Four games. Good luck.

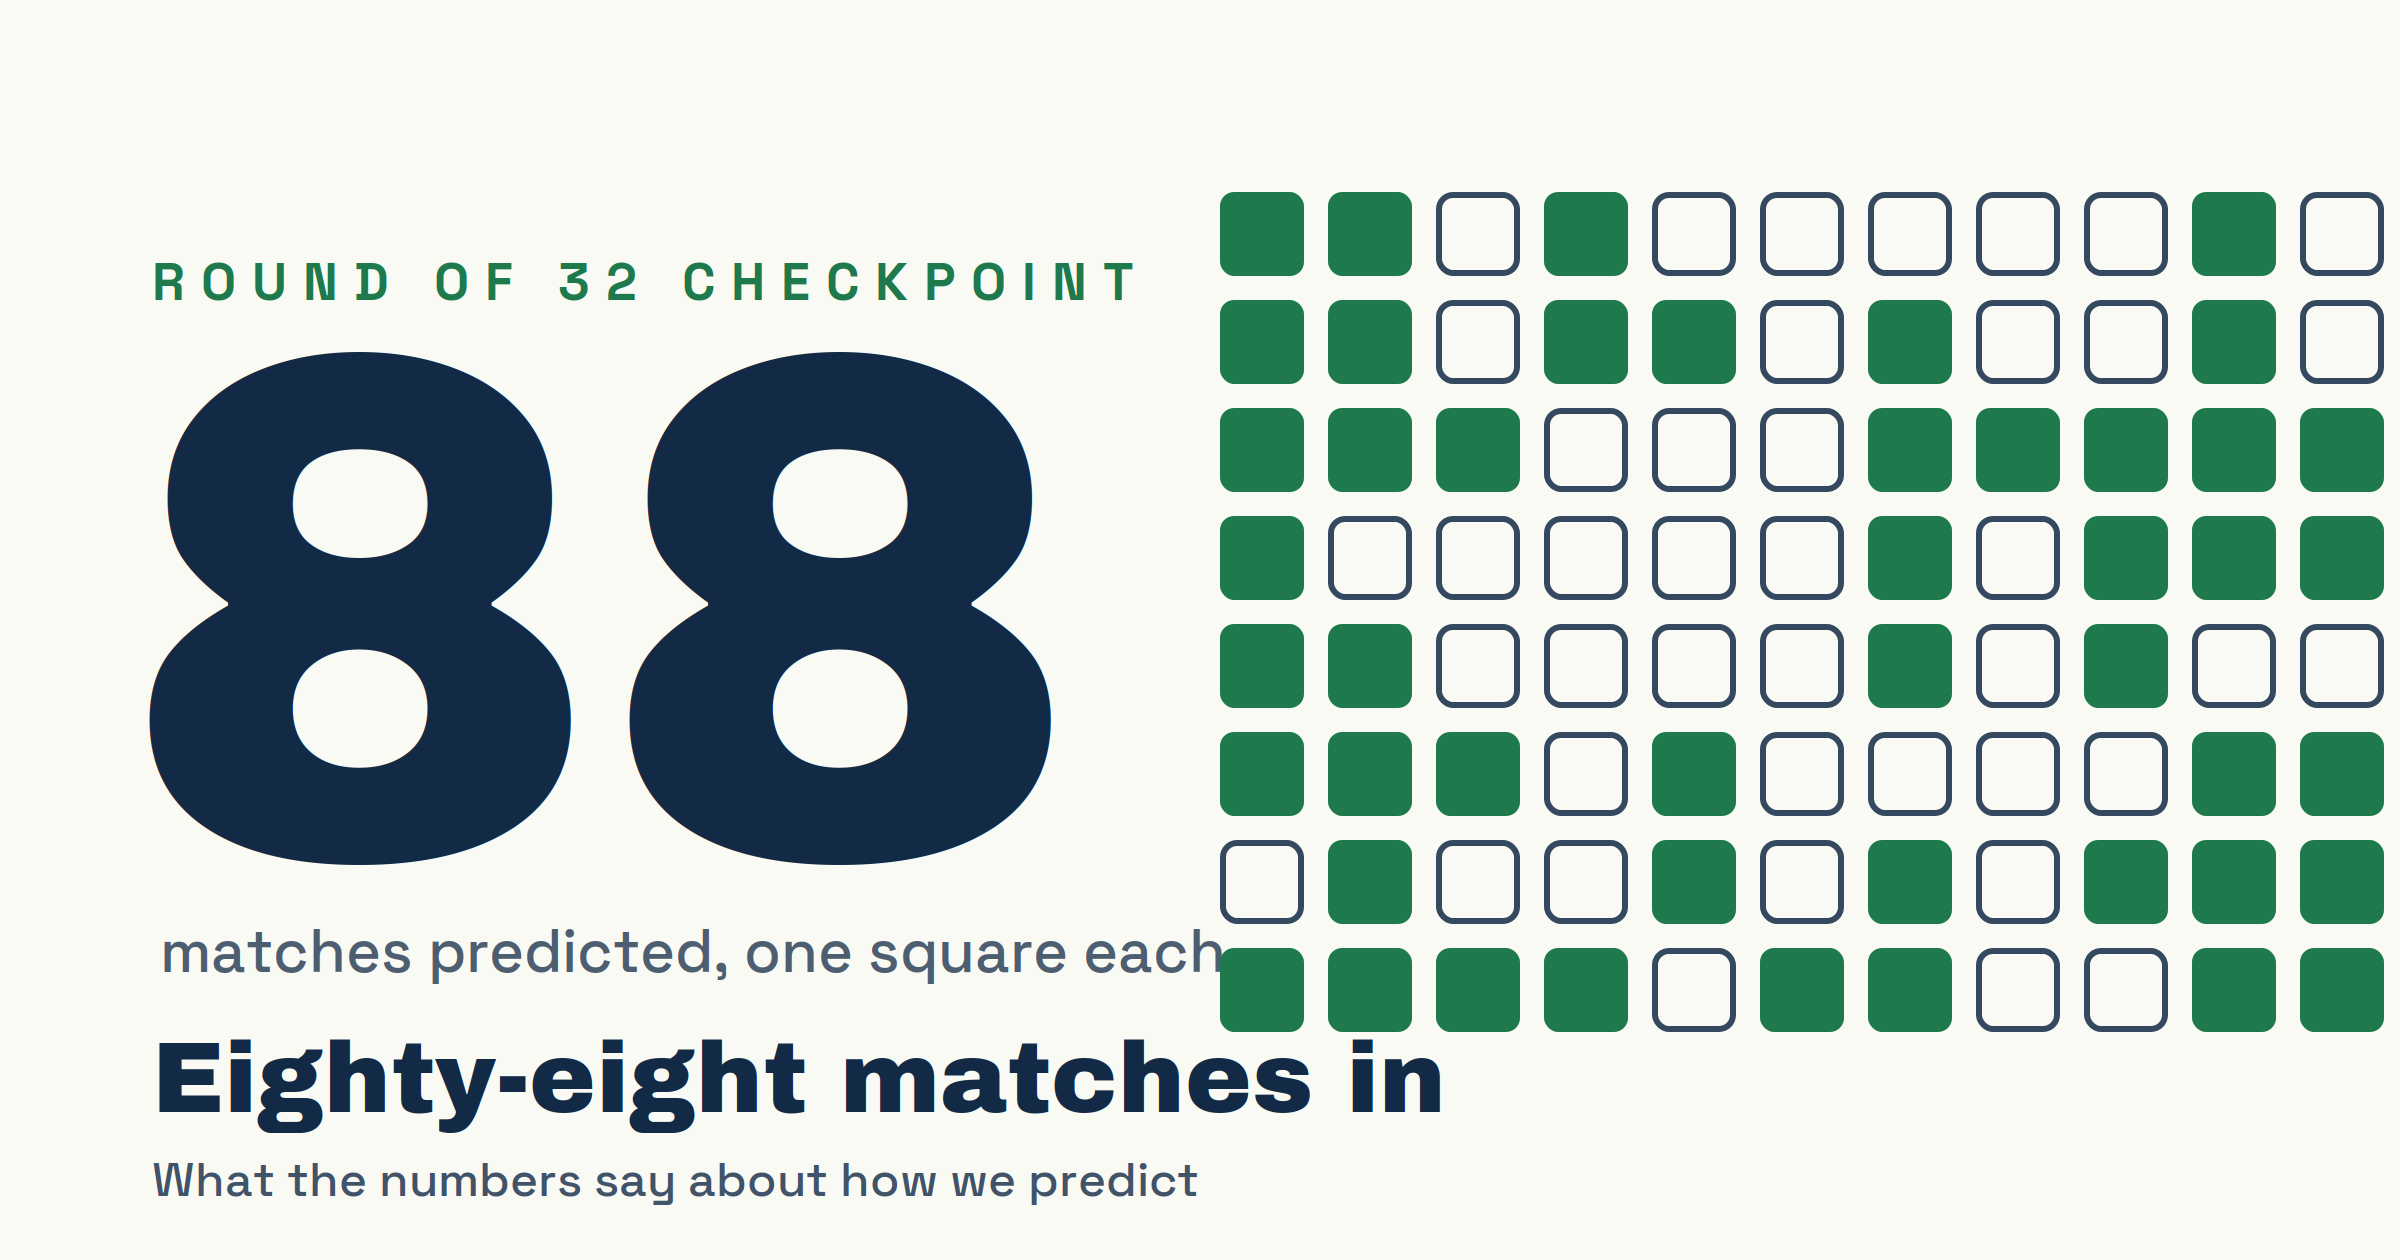
  • Eighty-Eight Matches In: What the Numbers Say About How We Predict

    Eighty-Eight Matches In: What the Numbers Say About How We Predict

    Eighty-eight matches are in the books and 97 of you have been filling coupons since the opening whistle. That is enough data to stop arguing about what works in this pool and start measuring it. So we did. What follows is the full autopsy: how we predict, where the points really come from, and why the safest coupon in the pool is also a guarantee of mediocrity.

    FIFA World Cup 2026

    88 completed matches · 97 players

    76%Favourite backed
    69%Favourite won7% gap to backing
    2.92Goals / game
    60%Result hit rate
    10%Correct score hit rate

    We love a favourite. The tournament only partly agrees.

    As a pool we backed the favourite in 76% of matches, and favourites delivered in roughly two out of three. That gap is the price of comfort, and it compounds quietly across 88 games. Draws tell the opposite story: we predicted them in 18% of matches, but the tournament served them up in 26%. On underdogs our volume was about right, 6% predicted against 7% actual, but our aim was not: only 9% of underdog picks landed. The lesson sits in the accuracy bars below. Favourite picks hit at 70%, draw picks at 33%, so a well chosen draw was worth far more to your total than yet another routine favourite. Liam Grech leads the pool on accuracy at 69%, Dave Evans props it up at 35%, and the average sits at 59%.

    Result split — predicted vs actual

    Win — favourite
    Predicted76%
    Actual67%
    Draw
    Predicted18%
    Actual26%
    Win — underdog
    Predicted6%
    Actual7%

    Accuracy by pick type

    Favourite picks70%
    Draw picks33%
    Underdog picks9%

    Best: Liam Grech (69%)

    Worst: Dave Evans (35%)

    Pool average: 59%

    Where the points actually come from

    If you think this game is about calling winners, the scoreboard disagrees. Over/under is the single biggest source of points in the pool, 41% of everything scored, comfortably clear of correct results at 32%. The exact scores we agonise over the longest contribute a humbling 5%. In other words, the quiet tick-box at the bottom of the coupon has been worth eight times the glamour pick.

    Where the points came from

    16,702Result32%
    21,395Over / under41%
    2,571Exact5%
    11,270Winner22%

    The coin flip that is not one

    Totals look like a coin flip, but the coin is loaded. With 2.92 goals per game, 55% of matches have gone over, so a player blindly ticking over on every coupon would have banked 240 points against the pool average of 221. Under is where the pain lives. When players went under, they lost by two or more goals 36% of the time, which means those were not near misses but misreads of the whole match. Pick under when you have a reason, not a feeling.

    Over/under — is it a coin flip?

    What actually happened

    55% over45% under
    Always pick OVER55%240 pts
    Pool average52%221 pts
    Always pick UNDER45%200 pts

    Dashed line = 50% — a coin flip.

    What happens when players pick under

    48%16%36%

    stayed under — won lost by 1 goal lost by 2+

    The favourite trap

    Now for the humbling part. A bot that picked Favourite 1-0 in every single match, without watching a minute of football, would currently sit 52nd of 97. It beats nearly half the pool. The same bot on 2-1 lands 59th. So if your strategy has been safety, a spreadsheet formula is breathing down your neck. The data behind it is unambiguous: the more favourites a player backed, the fewer points they scored, a strong correlation across the whole pool. And the players who escaped that gravity did it the only way possible. Nine of the top ten climbed on three or more big-odds hits. Safety is not a strategy in this pool. It is a ceiling.

    Same result, every game

    Pick Favourite 1–0 every game and you would finish #52 of 97 (551.78 pts).

    1–1 every game441.42#92
    2–2 every game454.42#91
    Favourite 1–0 every game551.78#52
    Underdog 1–0 every game277.20#94
    Most-picked 2-1 every game542.58#59

    Draws hit 26% of games but were priced at 22%.

    9 of the top 10 climbed on 3+ big-odds hits — pool average: 4.2.

    The favourite trap: the more favourites you backed, the fewer points you scored (r 0.81).

    Matches we nailed, matches that nailed us

    Brazil 3-0 Haiti was the pool’s finest hour, called exactly by 48 players. Uzbekistan v Colombia was our most united coupon, with more than half of us on the same 0-2. At the other end of the dignity scale sits Spain v Cape Verde: every single player backed the favourite, and the game finished 0-0, the single biggest collective miss of the tournament. Germany 7-1 Curaçao supplied the fireworks, Japan v Sweden scattered us across fifteen different scorelines, and Belgium v Senegal split the room almost down the middle.

    Brazil 3-0 HaitiMost-nailed match48 of 94 nailed it
    Japan v SwedenMost varied scorelines15 scorelines · top 37%
    Uzbekistan v ColombiaMost united match53% on 0-2
    Germany 7-1 CuraçaoHighest-scoring match8 goals
    Spain v Cape VerdeBiggest collective miss100% backed the favourite · finished 0-0
    Belgium v SenegalMost contested gamehome 37 · away 26

    The scorelines that never showed up

    A moment of silence for the ghosts. Thirty-five picks went on 2-3, fourteen on 0-5, and seven optimists backed a 7-0, none of which has happened anywhere in 88 matches. Meanwhile the pool’s overall instincts were sound in one respect: 2-1 was our most-picked scoreline, and 1-1 the most common actual result, appearing twelve times. The problem is not our sense of what football looks like. It is that we keep parking it on the wrong team.

    Most-picked scorelines that never happened

    2-335 picks
    0-514 picks
    7-07 picks
    2-45 picks
    5-23 picks

    1% of all predictions were on results that never occurred.

    32Near-unanimous gamesfav 26 · draw 6 · u/dog 0
    32%Pool favourite missed28 of 88 matches
    23%Draw-capture rateacross 23 drawn games
    16Exact-score leadersDaphne Hili1 still on zero
    2-1Most-picked scoreline14% of all predictions
    1-1Most common resulthappened 12 times

    What the top ten do differently

    The leaders confirm the pattern. The top ten’s biggest edge over the rest of us is not clairvoyance on results, where they hold a modest advantage, but discipline on totals: 51 over/under hits against the pool’s 44, worth 35 extra points on that category alone. Nathan Heep leads on 650.22, with Daphne Hili, who also tops the exact-score count with 16, less than seventeen points behind. Ten men could not stop her; a two-goal swing certainly could not.

    Where points are won — top 10 vs pool average

    Over / under
    Top 1051 hits256 pts
    Pool avg44 hits221 pts
    Correct results
    Top 1056 hits198 pts
    Pool avg50 hits172 pts

    Standings

    1. 1Nathan Heep650.22
    2. 2Daphne Hili633.44
    3. 3Karl Vassallo630.84
    4. 4Daniel Sammut625.92
    5. 5Gary Rizzo625.66

    Completed matches only (confirmed final scores).

    Eighty-eight down, sixteen to go. The knockout rounds will punish the timid and reward anyone brave enough to price a draw before extra time or an ugly under correctly. When the trophy is lifted we will run these numbers one last time and find out who was actually paying attention. Until then: fewer reflex favourites, more conviction on totals, and no more picks on 2-3.

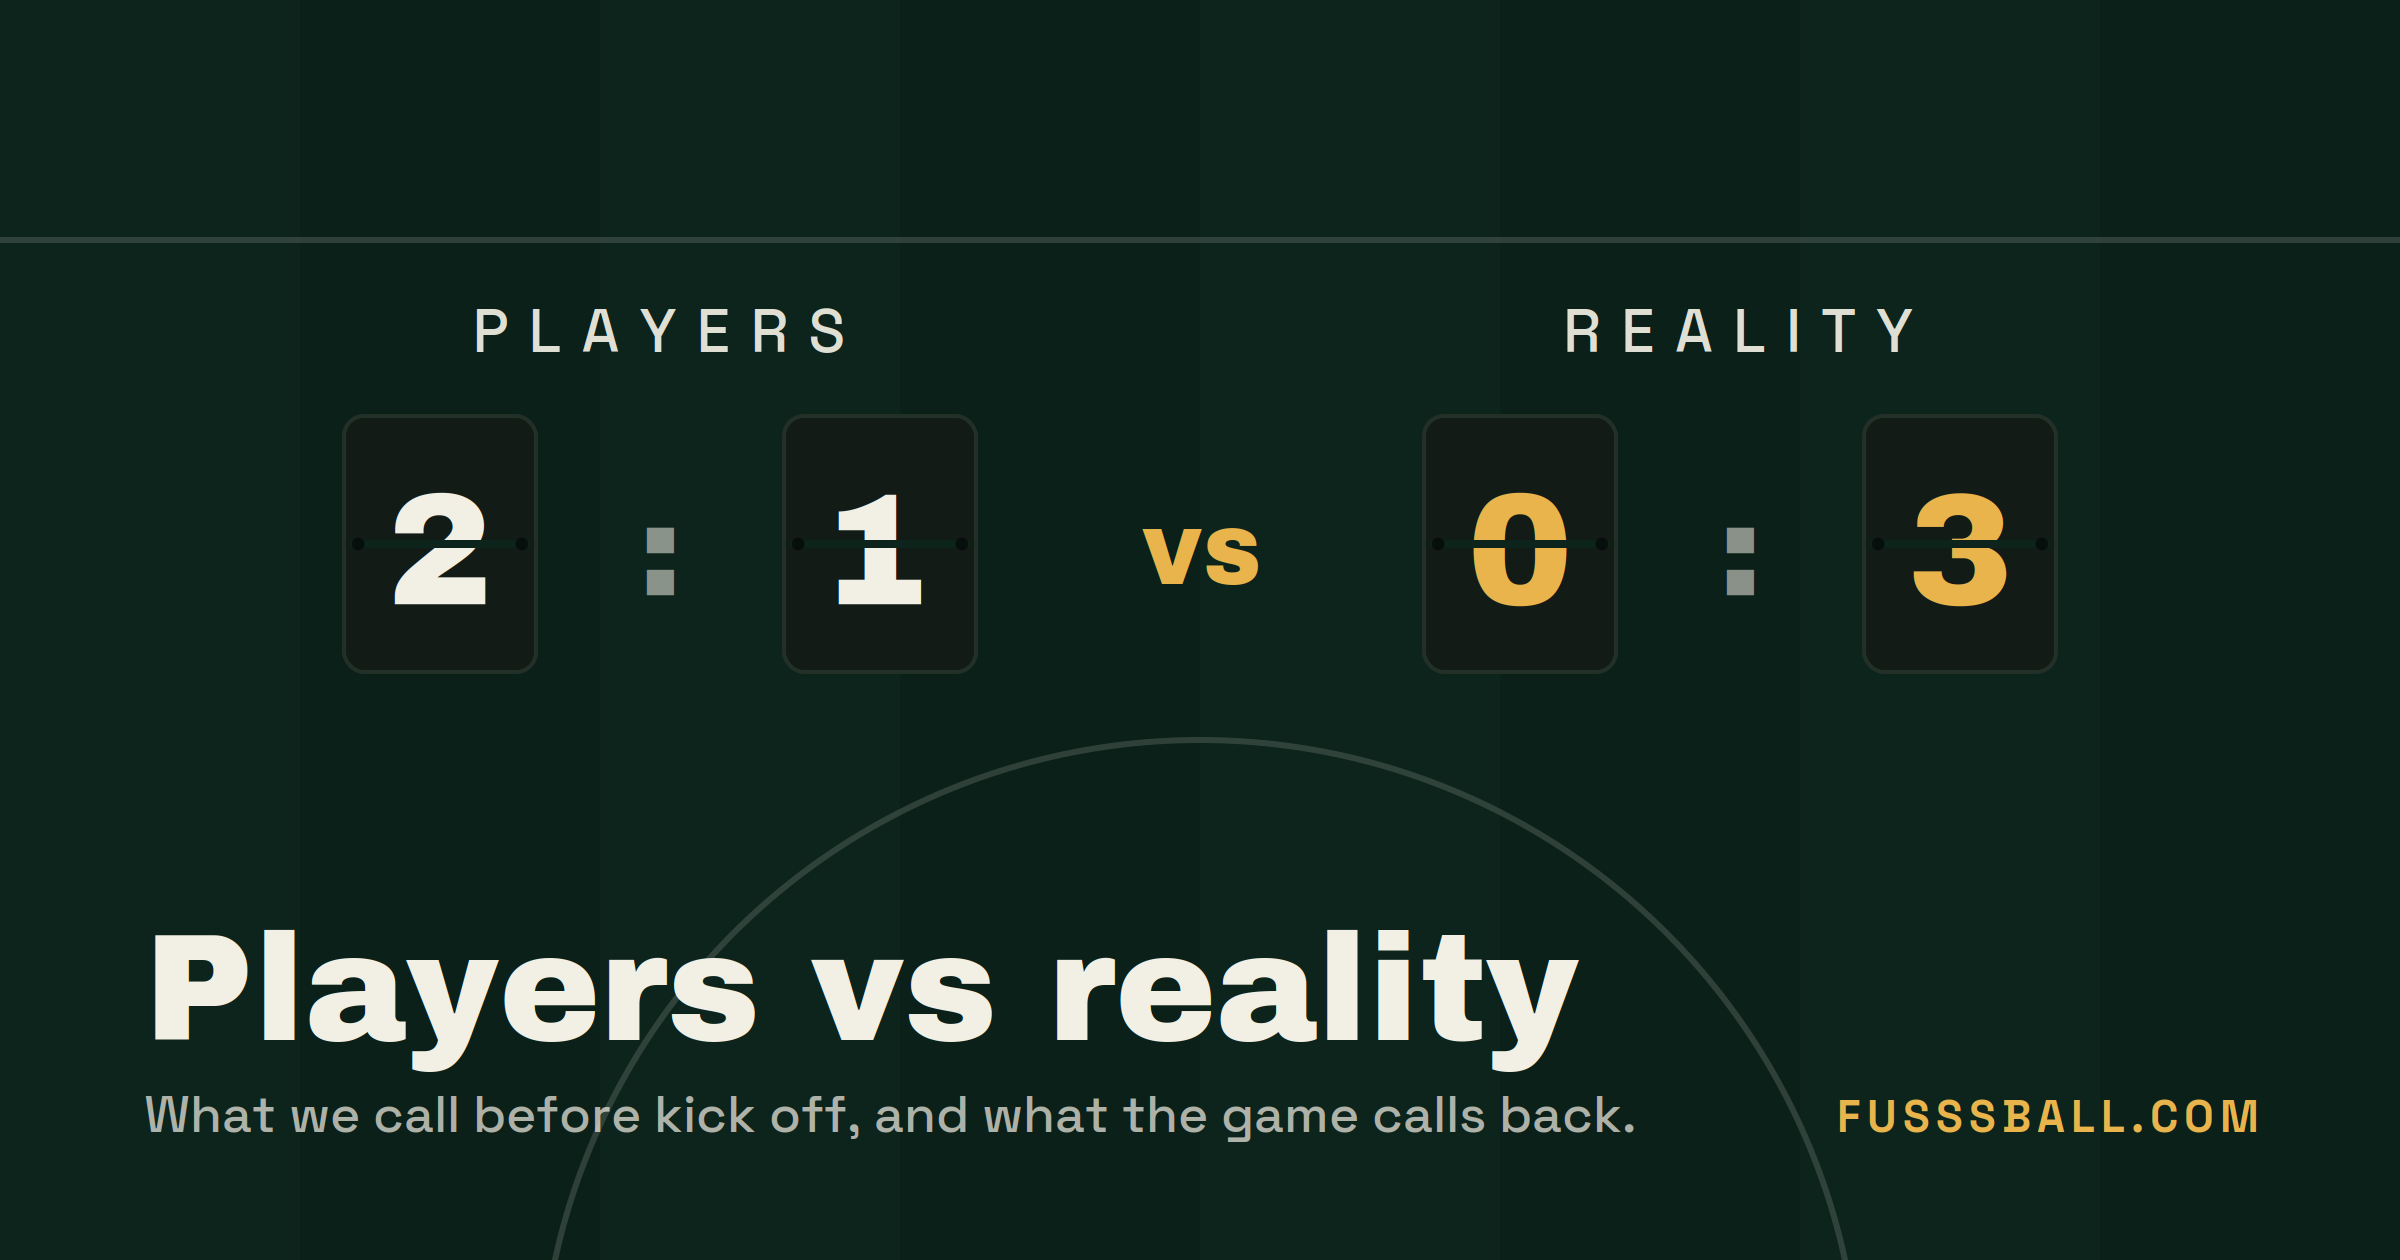
  • Players vs reality

    Players vs reality

    After 32 games and 97 players — Matchday 1 complete, eight games into Matchday 2.


    The big picture

    Players love a favourite. The feeling isn’t mutual.

    Players backed the fav

    79%

    Fav actually won

    54%

    On average 79% of players backed the favourite each game — but the favourite has won just 54% of the time. A 25-point gap, mostly paid for in draws.


    Scoreline vs reality

    Players’ favourite pick vs the most common result.

    Players’ go-to

    2–1

    BUT

    Most common result

    1–1

    2–1 was picked 405 times across the pool. The most common actual result? A 1–1 draw — seven times in 32 games.


    Players call goals right — just not winners

    Players: Over 2.5

    50%

    Reality: Over 2.5

    47%

    Players read goal totals almost perfectly. It’s overrating the winner that keeps costing them.


    By the numbers

    100%

    backed Spain — and nobody got it

    All 97 players picked Spain to beat Cape Verde. Final score: 0–0. A clean zero on the result for everyone.

    31%

    of games ended in a draw

    Ten of 32 matches. The draw is the tournament’s great leveller — and the biggest killer of chalk picks.

    52%

    of result picks landed

    Just over half of all 1X2 calls were correct. When 79% back the same team every game, a 52% hit rate stings.

    8%

    of picks nailed the exact score

    Across every prediction made, only about 1 in 12 got the exact scoreline right — the hardest part of the game.

    3.0

    goals per game

    96 goals across 32 games. Germany’s 7–1 win over Curaçao has done a lot of the heavy lifting on that average.

    7–1

    Germany · highest scoring game

    8 goals in Germany vs Curaçao — a rare night the brave Over-pickers were very well rewarded.


    Top 5 · the race

    #PlayerPoints
    1Manwel Borg Canalis186.14
    2Mark Camilleri184.78
    3graziella chircop178.28
    4Willi Barbara174.32
    5Karl Vassallo172.58

    Top 5 take the prize. The cut-off sits at 172.58 — and just 1.74 separates 5th from 4th. It’s tight at the top.


    Favourite = the team most of the pool backed to win that match. Standings current after 32 games · prediction stats across all pool picks to date · 97 players.

  • The World Cup Is Here and So Is Your Pool

    The World Cup Is Here and So Is Your Pool

    The wait is over. The FIFA World Cup 2026 has opened in historic fashion: for the first time, the tournament was launched with three opening ceremonies across all three host nations on two consecutive days. Mexico got things under way at Mexico City Stadium on 11 June, with Canada and the United States staging their own ceremonies on 12 June. It is the first time the competition has been kicked off simultaneously across three countries: Mexico, the United States and Canada, in a record edition of 48 teams and 104 matches running all the way to the final on 19 July.

    It is the biggest World Cup in history, and it is the tournament we built this edition of Fussspool around. If you have joined a pool this summer, here is everything you need to know.

    This content is available to edition participants only.

    What’s New in This Edition of Fussspool

    This World Cup edition is the most capable version of Fussspool we have shipped. Three changes stand out.

    Automatic live scores

    Scores now update on their own. During the group stage, results are pulled and refreshed automatically every 30 minutes in the group stage, so standings and coupon points keep pace with the matches without anyone having to enter anything by hand.

    A web app with notifications on your phone

    Fussspool can now be added to your phone’s home screen as a web app and, with your permission, send you push notifications — a reminder before a coupon deadline, or an alert when new matches are inserted. It is opt-in: notifications only ever go out if you allow them.

    A ground-up refresh of a 20-year-old script

    Fussspool grew out of a pool script that has been running for two decades. This edition is a full rebuild of that foundation, modernised, tidied up and brought in line with current standards, so the experience that long-time players know stays familiar while running on something far more solid underneath.

    Good Luck

    With so many of you in the running, this is shaping up to be our most competitive edition yet. Lock in your coupons, keep an eye on the standings, and may the best predictor win. Enjoy the World Cup.

  • A football pool with odds

    Fusssball’s scoring scheme differs from other football pools, as for every guessed result (i.e. every guessed home win, away win or draw game) a player earns a multiple of the odd assigned to that football match. All odds are assigned a few days before the fixture date, with the odds remaining fixed once announced. 

    Moreover, a player earns an additional points for every final score guessed and a bonus for correctly predicting whether the match is high-scoring or low-scoring.

    During the knock-out phase of the determined competition (i.e. a winner must be decided during the football match or at the end of the 2 legs), more additional points are earned for the players that guess which team would make it through.

    All bets are settled at the end of Extra Time (if applicable). If no extra time is played, then bets are settled at the end of 90 minutes plus injury time.

    The participant with the highest points wins the competition. In case two participants are tied with the same points tally, certain criteria will apply. More info on Rules of the Game.