Ninety-seven of us started this thing with a coupon and a theory, and after five weeks the pool has produced exactly what a World Cup should: a leaderboard nobody predicted, a leader who has held the top spot for about a week, and a pile of evidence that most of us were wrong about how to win.
Here is where things stand, and what the numbers say about how we got here.
FIFA World Cup 2026
The top five, and the fourteen points between them
Kevin Farrugia leads on 799.22. Daniel Sammut is 6.66 behind. Nathan Heep is 0.08 behind him. Liam Grech and Andrew Arrigo sit within fifteen points of the summit.
That is not a lead. That is a rounding error with a trophy attached. One correct scoreline at a decent price in the semifinals settles this — and there are still four matches to play.
Standings
- 1Kevin Farrugia799.22
- 2Daniel Sammut792.56
- 3Nathan Heep792.48
- 4Liam Grech785.96
- 5Andrew Arrigo784.44
Completed matches only (confirmed final scores).
Five leaders in six rounds
Nobody has owned this tournament. Mark Camilleri led after Matchday 1. Niki Borg took it on Matchday 2. Nathan Heep grabbed it on Matchday 3 and was the only player to hold the top spot through a full round. Daniel Sammut led out of the Round of 16. Kevin Farrugia leads now.
Underneath, the knockouts have been carnage. Liam Grech was 95th of 97 after the groups and is now fourth. Gary Rizzo went 87th to 8th. And spare a thought for graziella chircop, who was second and is now 79th — the harshest fall of the tournament, and a reminder that a good group stage buys you nothing.
The Race — leader after every round
- Matchday 1Mark Camilleri
- Matchday 2Niki Borg
- Matchday 3Nathan Heep
- Round of 32Nathan Heep
- Round of 16Daniel Sammut
- QuarterfinalsKevin Farrugia
Gold marks a new leader; plain text means the same player held top spot.
The bit nobody wants to read
Imagine a player who never watched a match, never read a preview, never agonised over whether to go 2–1 or 2–0. Every single game, they wrote down the same thing: favourite wins 2–1. Done. Coupon in, phone away.
That player would be 15th of 97 right now, on 758.98 points.
Eighty-two of us — five weeks of research, group chats, gut feelings, late-night edits before kickoff — are behind a robot with one idea. The robot also beats the Hive Mind, the theoretical player who submits whatever the pool’s most popular pick is each game (741.54, 22nd).
Same result, every game
Pick Favourite 2–1 every game and you would finish #15 of 97 (758.98 pts).
Draws hit 24% of games but were priced at 23%.
10 of the top 10 climbed on 3+ big-odds hits — pool average: 4.7.
The favourite trap: the more favourites you backed, the fewer points you scored (r 0.82).
Note the last footnote, because it is the whole tournament in one line. The more favourites you backed, the fewer points you finished with. Every player at the top of this table climbed there on the back of at least three big-odds hits.
We love a favourite. We hate a draw.
Across 100 matches, the pool backed the favourite 75% of the time. The favourite actually won 68% of the time. That five-to-seven point gap is not a rounding error — over 100 matches it is a systematic tax on everyone’s coupon.
The gap has to go somewhere, and it went where it always goes: the draw. We predicted draws in 18% of games. Twenty-four percent of games were drawn.
Result split — predicted vs actual
And when we did call a draw, we were mostly wrong anyway: draw picks landed just 31% of the time, against 71% for favourite picks. Underdog picks came in at a bruising 13%.
Accuracy by pick type
Best: Liam Grech (72%)
Worst: Dave Evans (35%)
Pool average: 59%
Liam Grech has read this tournament better than anyone — 72% of his results correct, against a pool average of 59%. Which is precisely how you go from 95th to 4th. At the other end, Dave Evans is on 35%, and we salute the commitment.
Over/under: the quiet kingmaker
Ask anyone in the pool where the points are and they will talk about scorelines. They are wrong.
Over/under is the single largest source of points in this tournament — 24,205 of them, 37% of everything scored. The exact-score jackpot everyone chases? Four percent. We are all straining for the hardest points on the board while the biggest pot sits in the box most people tick in two seconds.
Where the points came from
Here is the part that stings. The tournament has been an over tournament — 56% of matches went over the line, at 2.92 goals a game. A player who simply ticked OVER every single time, without thought, would have banked 280 points. The pool average is 250.
Thirty points, free, for doing less thinking. And when we backed under, we lost by two goals or more in 37% of cases — that is not bad luck, that is a read on the tournament that was simply wrong.
Over/under — is it a coin flip?
What actually happened
Dashed line = 50% — a coin flip.
What happens when players pick under
stayed under — won lost by 1 goal lost by 2+
Which brings us to the cleanest explanation of the leaderboard there is. Compare the top ten against everyone else. They are not wildly better at picking winners. They are better at the boring stuff, consistently, over 100 matches — six more over/under hits and eight more correct results than the average player. That is 67 points of daylight, accumulated a coupon at a time.
Where points are won — top 10 vs pool average
Over / under
Correct results
The giants never lose. They draw.
Twenty-three times this tournament, a team went into a match at 1.30 or shorter. Not one of them lost. Eighteen won. Five drew.
So the instinct to back the monster is sound. The trap is the scoreline: those five draws are where a lot of coupons quietly bled out, and they are the reason the favourite-heavy strategy underperforms despite favourites winning most of the time.
Monster favourites
23 matches where the shortest price was 1.30 or less
The giants never lose… they draw.
The single best call of the tournament
Ninety-five of us looked at Ecuador v Curaçao and did the sensible thing. Two of us didn’t.
Sylvana Bosch and Alan Arrigo went 0–0 at a price of 9.99, and walked away with 27.98 points from one match — the biggest single-match haul anyone has managed. That is roughly twice the entire gap between first and fifth place, from one game, off one contrarian coupon.
Biggest single-match jackpot
Moments the pool will not forget
Spain v Cape Verde is the one that will live longest. Every single one of us — 100%, no dissenters, not one brave soul — backed the favourite. It finished 0–0. A perfectly unanimous pool, perfectly wrong, together.
We are also, collectively, wildly optimistic about goals. Fourteen of us predicted a 0–5. Seven went 7–0. None of it happened.
Most-picked scorelines that never happened
0% of all predictions were on results that never occurred.
And a few numbers that say everything about how this pool thinks: our favourite scoreline is 2–1 (15% of every prediction submitted, but it only actually happened in 9% of matches). The most common real result was 1–1, twelve times. Thirty-three matches were near-unanimous, and in exactly zero of them did we collectively back an underdog.
Daphne Hili has sixteen exact scorelines. One player, somewhere in this pool, still has zero. We’re not naming them. They know.
Four matches left
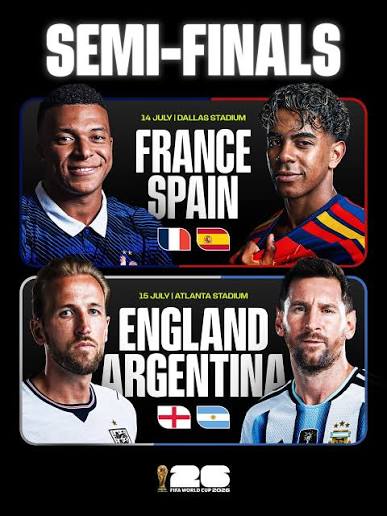
Two semifinals, a third-place playoff, a final. That’s it. That’s all the football left.
Fourteen points separate first from fifth, and one 9.99 shot has already been worth twenty-eight. Kevin Farrugia leads, but he has held the top spot for one round out of six, and every previous leader in this tournament has been overtaken. Daniel Sammut and Nathan Heep are close enough to pass him on a single scoreline. Liam Grech is the form player in the pool and is climbing.
If the last 100 matches taught us anything, it’s this: the favourite usually wins, but backing the favourite doesn’t. The points are in the draws nobody calls, the overs nobody thinks about, and the one match where you look at a price of 9.99 and decide to be brave.
Four games. Good luck.